The Performance by Segment dashboard is where you can analyze and compare ranking data by a variety of custom and built-in filters, which we call segments.
Use the Rollup dropdowns to select your desired brand or domain. You may also choose to filter by keyword group and date range.
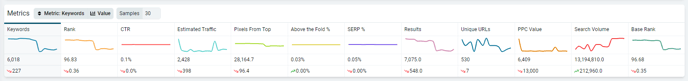
You can choose the kind of data you want to analyze by using the Metrics tabs.
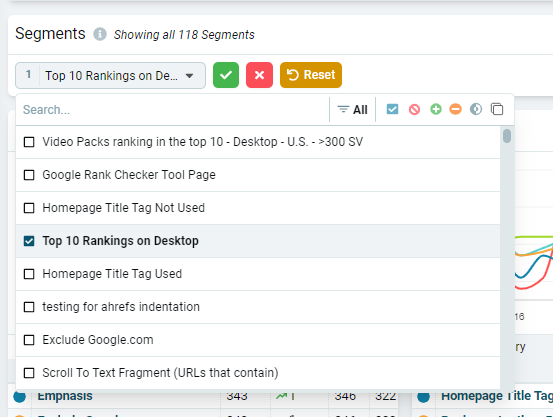
Use the Segments dropdown to select specific segments to compare. Leaving it empty will show you data for all your segments.
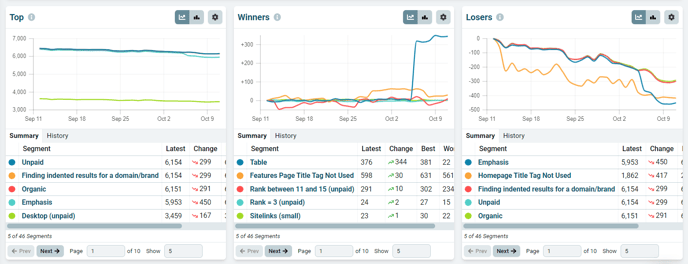
Below the segments dropdown, you will see the Top, Winners, and Losers chart so you can quickly determine which segments are your best performers as well as which ones have gained or lost the most over the specified time period.
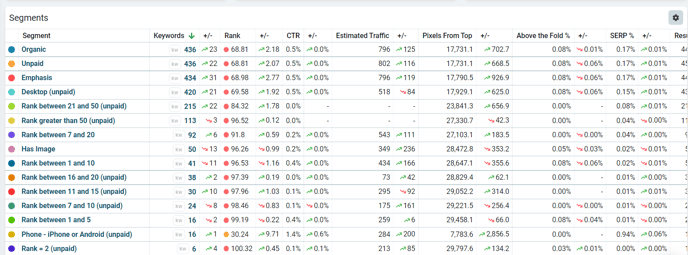
Finally, you'll find the same data in table form at the bottom of this dashboard. You can sort by the different columns to get a better idea of how you are performing in each metric.
For more information about Nozzle dashboards, click here.