![logo-blue copy 2.png]](https://help.nozzle.io/hs-fs/hubfs/logo-blue%20copy%202.png?height=33&name=logo-blue%20copy%202.png)
Every Nozzle performance dashboard shows a row of metrics at the top — things like Rank, Share of Voice %, and Estimated Traffic. By default we show six of them, but you can add or remove any metric you like using the Metrics picker. This guide explains where the picker is, how to use it, and how to bring back a metric (like Base Rank) that isn't showing.
The six default metrics

When you open a dashboard, the Metrics row starts with these six:
- Keywords — how many keywords match your current Focus, Segment, and date range.
- Rank — your position counting every result on the SERP.
- Share of Voice % — your share of the estimated traffic available for these keywords.
- Estimated Traffic — estimated clicks based on rank and search volume.
- Pixels From Top — how far down the page your result appears, in pixels.
- Above the Fold % — your share of the visible screen area before scrolling.
These six are just the starting point. Nozzle tracks many more metrics — Base Rank, CTR, SERP %, and others — and every one of them is available through the picker.
Opening the Metrics picker
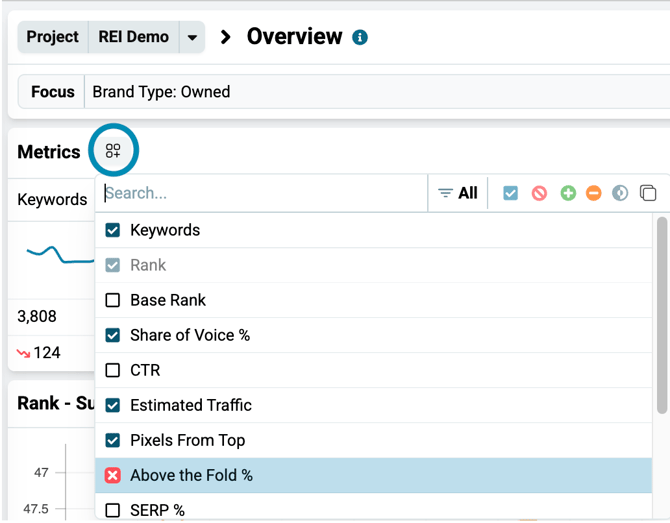
Look for the grid icon (the small squares with a plus) next to the word Metrics, just above the metric tiles. Click it to open the picker. You'll see the full list of metrics, each with a checkbox showing whether it's currently on your dashboard.
Adding or removing a metric
In the picker, a metric with a checked box is showing on your dashboard; an unchecked box is hidden.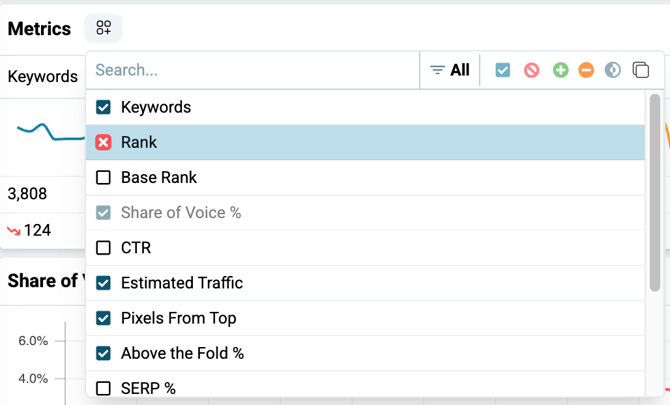
- To add a metric, check its box. It appears as a new tile in the Metrics row.
- To remove a metric, uncheck its box (or hover over its tile in the Metrics row and click the red remove icon).
- To find a metric quickly, type into the Search box at the top of the picker.
Why one metric looks greyed out
You may notice that one metric in the picker has a greyed-out checkbox instead of the solid blue one. That greyed metric is the one currently selected in the Metrics row — the tile that's highlighted and whose trend drives the summary charts below (for example, the "Base Rank – Summary" chart).
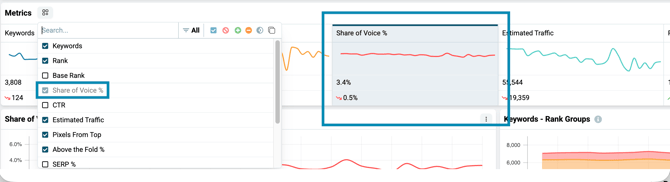
The checkbox is greyed because you can't remove a metric while it's the active one — the dashboard always needs a selected metric to build its summary charts. If you want to remove it, first click a different tile in the Metrics row to make that one active. The greyed state moves to the new selection, and the metric you just deselected becomes removable again. Only one metric is selected at a time.
Bringing back Base Rank
A common question: "Where did Base Rank go?" Base Rank isn't one of the six defaults, so on a fresh dashboard you won't see it until you add it. Open the Metrics picker, check Base Rank, and it appears as a tile. Click that tile to make it the selected metric and the summary charts will switch to Base Rank.
Base Rank is useful when you want to exclude SERP features — ads, People Also Ask, and other Google features — and see your position counting only traditional organic results and featured snippets. For more on what it measures, see What is Base Rank?
This works on every dashboard
The Metrics picker is available on every performance dashboard (Overview, Competitors, Keywords, and so on). The set of metrics you can choose from is the same across dashboards — only the defaults differ. Adjust the metrics on one dashboard and it won't change the others, so you can tailor each view to what you're analyzing.