The Rundown
The Google Search Console Overview dashboard pulls live data from your Google Search Console account so you can see more of your ranking data in one place.
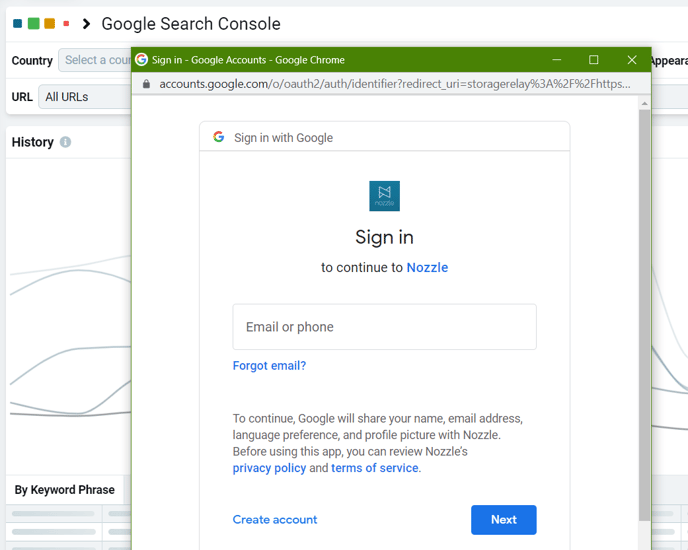
When you enter the GSC dashboard in Nozzle, you'll be prompted to sign in with your GSC account.
Once you've signed in, Nozzle's dashboard will show all the data that appears in Search Console's Performance on Search Results view, but with Nozzle's user interface.
You can see a comparison of the two in the images below:
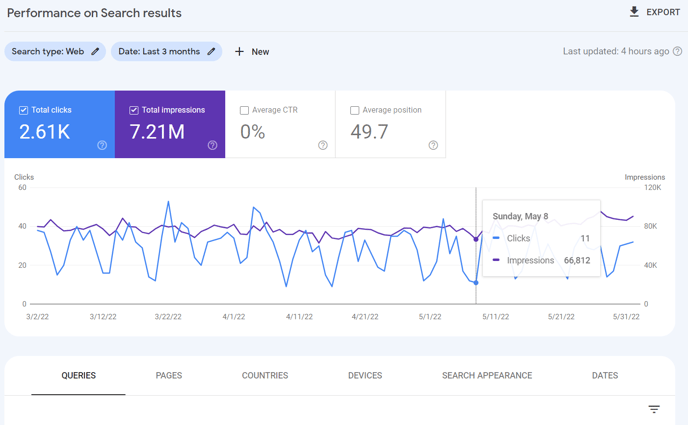
Google Search Console: Performance on Search Results
Nozzle: Google Search Console Overview dashboard
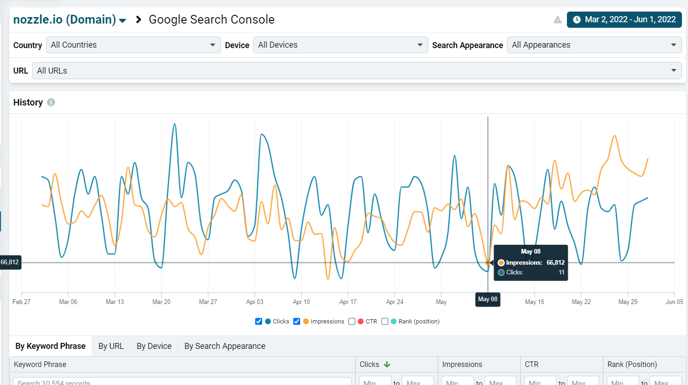
📅 Keep in mind that Search Console defaults to a 3-month date range, whereas Nozzle keeps the date range you most recently viewed. This can distort average values.
Nozzle's dashboard functions just like Google's, but with minor differences.
The Minor Differences
Wording
Nozzle's GSC dashboard uses Nozzle lingo for the data Search Console offers.
Google's terms vs. Nozzle's:
- Queries = Keyword Phrases
- Pages = URLs
- Position = Rank
Defaults
Google's date range defaults to 3 months, whereas Nozzle's defaults to 30 days or whatever range was last used.
Also, by default, Google only shows clicks and impressions, whereas Nozzle shows all four metrics (clicks, impressions, CTR, and rank/position).
Both, however, give the option to show any combination of the four.
Layout
Nozzle's GSC dashboard has a slightly different layout that Search Console's Performance on Search Results view. Nozzle's dashboard has most of the same elements, but it feels more like Nozzle than Search Console.
We'll walk through these elements in the next section.
Data Retention ⚠️IN DEVELOPMENT⚠️
While this dashboard currently only pulls and displays Search Console's data, soon Nozzle will store all your Search Console data along with your Nozzle data. This will allow you to analyze a longer history of Search Console data than Google's cutoff of 16 months.
Walkthrough
Nozzle's Google Search Console dashboard is easy to use if you have a basic knowledge of Nozzle and Search Console.
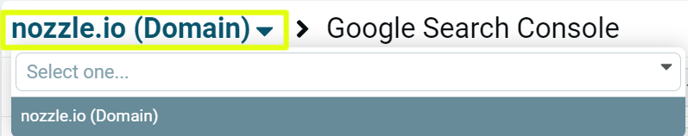
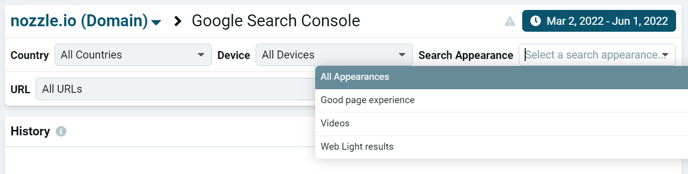
You can click on the domain name at the top of the dashboard to switch between the domain properties you want to see data for.
Use the date range button and dropdown menus to filter your Search Console data by date, country, device, search appearance, and URL (page).
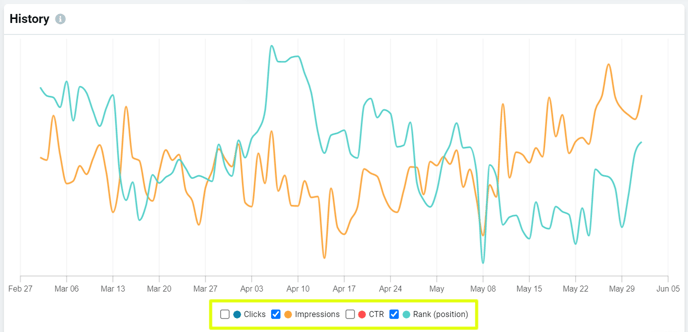
Select any or all of the boxes at the bottom of the history chart to toggle displaying those metrics in the chart.
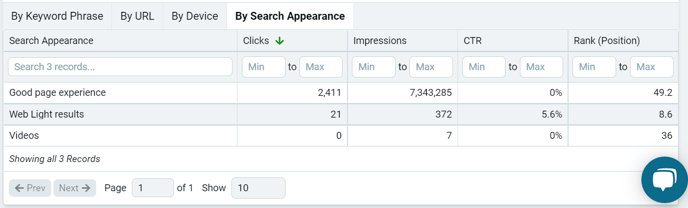
Use the table at the bottom of the dashboard to see additional data. The four tabs show data for keyword phrases (queries), URLs (pages), devices, and search appearance.
The table functions allow for searching, sorting, narrowing, and paginating through the data on each tab. Just type into the search bar to search the results; click one of the metric headings (Clicks, Impressions, CTR, or Rank (Position)) to sort by that metric; apply the Min to Max fields to narrow the data you see; and use the Prev and Next buttons, the Page field, and the Show field to view all the results.
We hope you enjoy the convenience of Nozzle's Google Search Console Overview dashboard.